Photo: Hoku-sou-san / CC BY-SA 3.0 · Wikimedia Commons
Chiba Prefecture
Kanto region · Prefecture
Official website
Chiba covers the Boso Peninsula, which is surrounded by the sea on three sides. It has Narita Airport and Tokyo Disney Resort, while agriculture and food industries, such as peanuts, Japanese pears and soy sauce making, are also active. The highest peak in Chiba is the lowest highest point of any prefecture.
- Peanuts
- Narita Airport
- The seas of Boso
- Soy sauce (Noda and Choshi)
Key facts
- Municipalities
- 54 (37 cities, 16 towns, 1 village)
Source: Statistics Bureau of Japan, 2025 Population Census (population, area and density); area from the Geospatial Information Authority of Japan (GSI), Area Statistics of Prefectures and Municipalities (2025). National ranks are among the 47 prefectures, ordered by this site from these values.
Places to know
- Urayasu City The home of Tokyo Disney Resort.
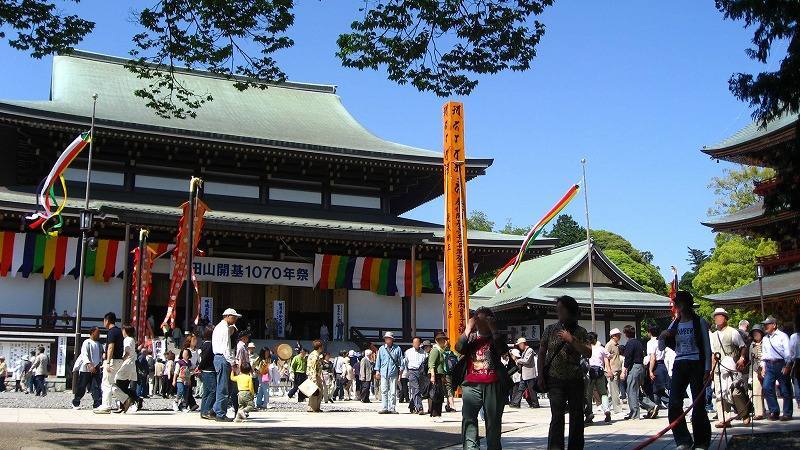
- Narita City Japan's gateway by air, and Naritasan Shinsho-ji Temple.
- Choshi City A town with a large fishing port and soy sauce making.
Current warnings, advisories and earthquakes
Places to visit in Chiba Prefecture
Browse by category
Shrines, temples, castles and historic sites
Chosen automatically, most popular first, from landmarks and cultural properties registered in Wikidata (we have not checked whether each is open). Names and descriptions: Wikidata (CC0); photos: Wikimedia Commons (photographer and license under each photo).
Municipalities in Chiba Prefecture (54)
| Municipality | Population | 5-year change | Area | Temperature nownearest AMeDAS |
|---|
| Chiba City | 994,846 | +2.0% | 272 km² | |
| Choshi City | 51,378 | −12.1% | 84.12 km² | |
| Ichikawa City | 494,354 | −0.5% | 57.44 km² | |
| Funabashi City | 651,663 | +1.4% | 85.62 km² | |
| Tateyama City | 41,119 | −8.9% | 110 km² | |
| Kisarazu City | 137,069 | +0.7% | 139 km² | |
| Matsudo City | 496,374 | −0.4% | 61.38 km² | |
| Noda City | 151,004 | −1.1% | 104 km² | |
| Mobara City | 83,571 | −3.7% | 99.92 km² | |
| Narita City | 133,634 | +0.5% | 214 km² | |
| Sakura City | 163,765 | −3.0% | 104 km² | |
| Togane City | 56,533 | −2.9% | 89.12 km² | |
| Asahi City | 59,573 | −6.5% | 130 km² | |
| Narashino City | 175,706 | −0.3% | 20.97 km² | |
| Kashiwa City | 435,302 | +2.1% | 115 km² | |
| Katsuura City | 15,101 | −10.8% | 93.96 km² | |
| Ichihara City | 259,897 | −3.6% | 368 km² | |
| Nagareyama City | 215,086 | +7.6% | 35.32 km² | |
| Yachiyo City | 204,904 | +2.7% | 51.39 km² | |
| Abiko City | 131,006 | +0.4% | 43.15 km² | |
| Kamogawa City | 28,988 | −9.7% | 191 km² | |
| Kamagaya City | 109,081 | −0.8% | 21.08 km² | |
| Kimitsu City | 77,367 | −5.9% | 319 km² | |
| Futtsu City | 38,711 | −8.8% | 205 km² | |
| Urayasu City | 172,707 | +0.8% | 17.25 km² | |
| Yotsukaido City | 94,174 | +0.6% | 34.52 km² | |
| Sodegaura City | 65,079 | +1.9% | 94.82 km² | |
| Yachimata City | 64,489 | −4.4% | 74.94 km² | |
| Inzai City | 110,339 | +7.5% | 124 km² | |
| Shiroi City | 60,932 | −2.4% | 35.48 km² | |
| Tomisato City | 49,659 | −0.2% | 53.88 km² | |
| Minamiboso City | 31,892 | −11.0% | 230 km² | |
| Sosa City | 31,092 | −11.3% | 101 km² | |
| Katori City | 65,971 | −8.8% | 262 km² | |
| Sanmu City | 44,973 | −7.2% | 147 km² | |
| Isumi City | 32,463 | −8.7% | 158 km² | |
| Oamishirasato City | 46,382 | −3.6% | 58.08 km² | |
| Shisui Town | 20,520 | −1.1% | 19.01 km² | |
| Sakae Town | 19,012 | −5.5% | 32.51 km² | |
| Kozaki Town | 5,267 | −9.4% | 19.90 km² | |
| Tako Town | 12,440 | −9.4% | 72.80 km² | |
| Tonosho Town | 11,904 | −10.0% | 46.25 km² | |
| Kujukuri Town | 12,877 | −12.0% | 24.44 km² | |
| Shibayama Town | 6,068 | −13.7% | 43.24 km² | |
| Yokoshibahikari Town | 19,824 | −10.2% | 67.01 km² | |
| Ichinomiya Town | 11,763 | −1.1% | 22.97 km² | |
| Mutsuzawa Town | 6,295 | −6.9% | 35.59 km² | |
| Chosei Village | 12,523 | −9.3% | 28.25 km² | |
| Shirako Town | 9,531 | −7.5% | 27.50 km² | |
| Nagara Town | 6,013 | −10.5% | 47.11 km² | |
| Chonan Town | 6,691 | −7.0% | 65.51 km² | |
| Otaki Town | 7,784 | −12.4% | 130 km² | |
| Onjuku Town | 6,332 | −7.9% | 24.85 km² | |
| Kyonan Town | 6,197 | −11.4% | 45.17 km² | |
Source: Statistics Bureau of Japan, 2025 Population Census (population in 2025; change compared with 2020). Area: GSI (2025). Designated cities are shown as one city (wards combined). "Temperature now" is the latest JMA AMeDAS observation (preliminary) at the nearest station in the same prefecture, loaded and shown unchanged when you open the page.